Visualising Attack Traffic using Cloudflare ELS, AWS Lambda, S3 and Golang
Everyone loves a nice shiny visual to look at, right? In the technology space we have massive amounts of data at our disposal, but very rarely do off-the-shelf tools give us meaningful insights in real-time. In this post I'll show you how you can make use of Cloudflare's WAF events to visualise the threats and exposures facing your applications by making use of cloud based services like Amazon S3 & Lambda.
The rationale
A key factor for the success of any IT programme is user engagement, and we in the Information Security space are no exception to this. With that said, one of the primary challenges we face is how do we get people talking about security. I've spoken with a number of people outside the IT space and it's not uncommon to hear them say, "I don't actually know what you do".
Truth be told, sometimes we don't know either! Or perhaps we are unable to articulate with those outside our industry what it is we do, or the perceived importance of our field. In any case, if you have ever been to an InfoSec conference before you'll know that the vendor booths are never far away. And it's my observation that the successful vendors are those who can capture by-passers using any means necessary, just to get the conversation started!
I was in Vegas last year for Blackhat and Defcon and this was especially true. The vendors who had the "shiny" stuff to demonstrate always had a high number of attendees scattered around their booths exchanging contact information for a glimpse of what they're advertising. Like us, they too know the value of capturing attention from potential customers. The challenge we face in industry is that our customers are the business, and we just don't know how to "sell" it like the vendors do. This is where cyber attack traffic visuals can help us out.
The value of cyber attack maps is not necessarily the data they're showing, it's how they can be used as a conversation starter - CSO Online
So how do we go about building our own?
The Technology used
We first need a semi-real time data source. Recently Cloudflare introduced Enterprise Log Share (ELS) in their early access program which gives us raw gzipped logs every couple of minutes.
Cloudflare
In addition to ELS, Cloudflare also gives us Web Application Firewall (WAF) & CDN based capabilities. By making use of these attributes in our log share, it then becomes trivial to classify our data based on what Cloudflare deems as malicious or benign. You also have the ability to customise your own rule sets - including rate limiting and IP based restrictions.
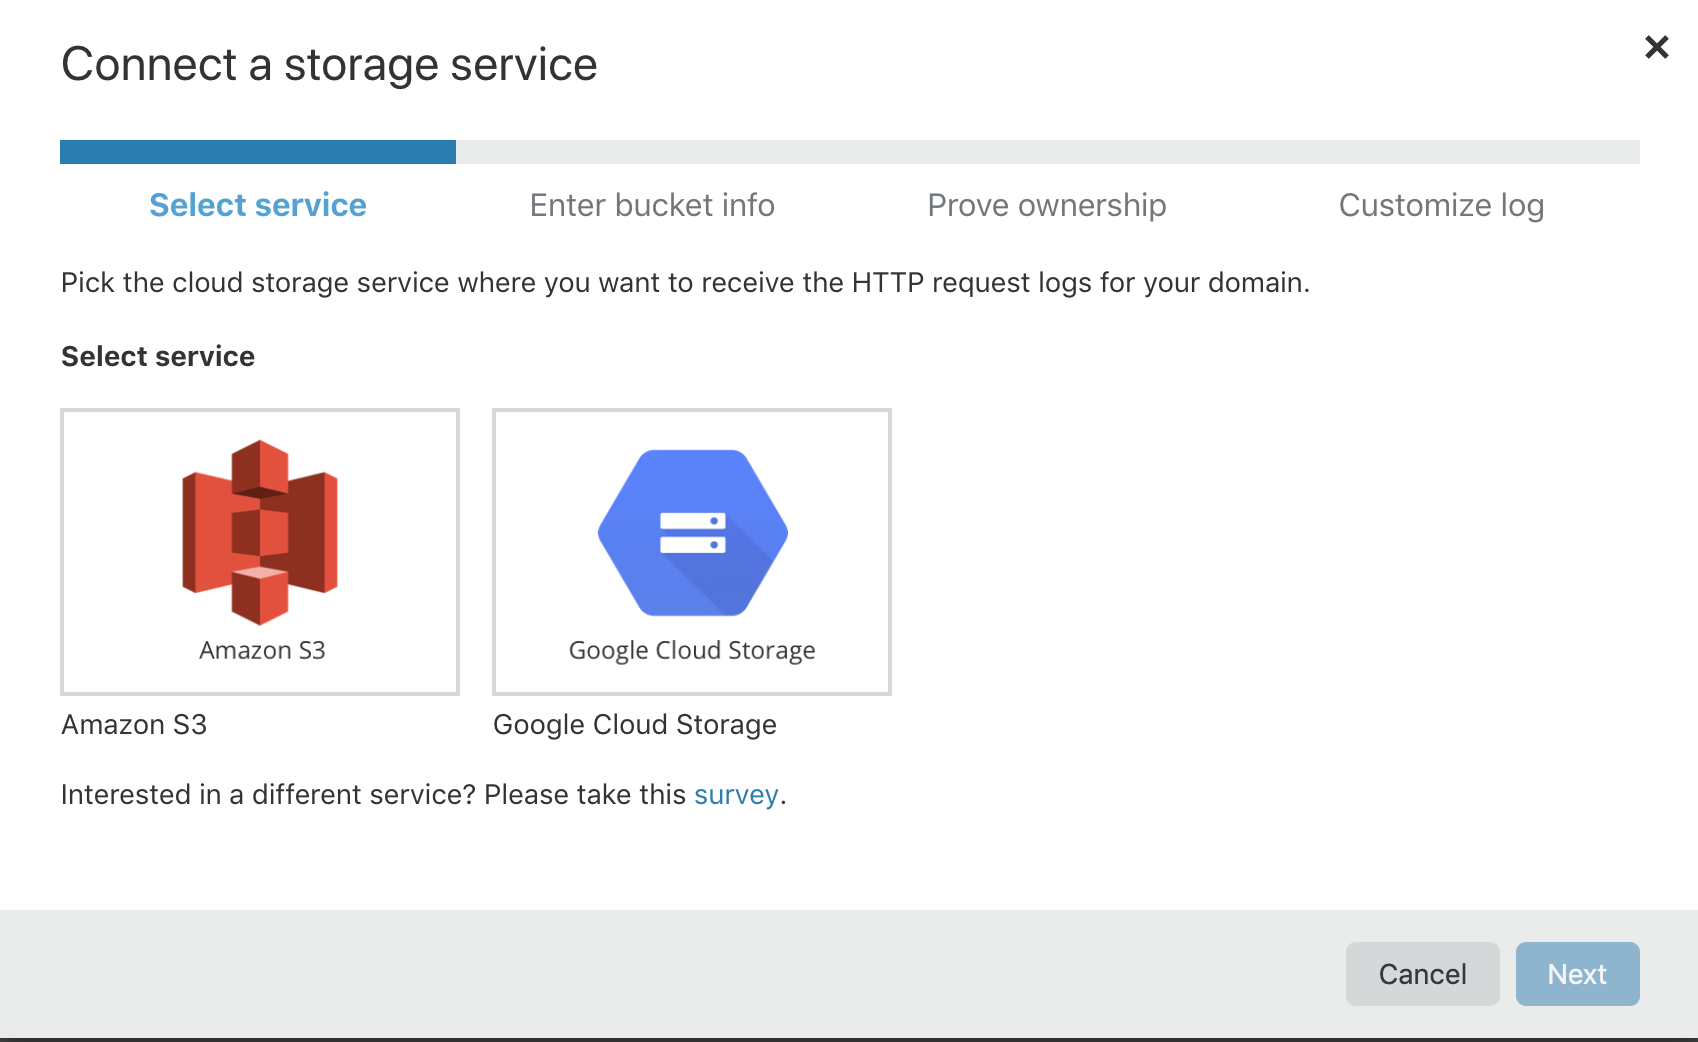
After you've got your data in good shape you can configure Cloudflare ELS by going to the portal and populating your data source under Analytics -> Logs. A simple txt file is provided which you'll copy to your destination storage service in order to prove ownership. From here you are now able to configure the parameters and write frequency of your Cloudflare logs.
The full list of Cloudflare's ELS parameters are available on their website.
Amazon
So you've set up your log storage at Amazon and Cloudflare is successfully writing logs every n minutes. Now you want to do something with those logs each time Cloudflare decides to write.
Amazon makes this easy by utilising their serverless platform Lambda. The beauty of Lambda is that IAM policies (permissions) are simple to configure, and at the same time you can "hook" events from other sources and have your code execute based on that operation. What this means for us is Lambda fires a handler function executing our code based on a PUT operation to an S3 bucket. (Cloudflare writes to our bucket, remember?)
So for each new write, execute our Lambda code and ship those logs off to a destination of our choice. Putting it all together so far looks like the following:
Cloudflare -> writes to -> Amazon S3 -> triggers PUT event -> AWS Lambda -> Golang Lambda writes -> Go Websock server
Web socket service in Golang (Go)
Our websocket implementation is two-fold. Our first websocket client is deployed using Lambda and is simply a means for transmitting S3 data over a single channel to a destination websocket server.
Our websocket server is where all the juicy stuff happens:
- Transforming Cloudflare logs to the correct structure
- Enriching the Cloudflare data source with org information, latitude and longitude
- Performing buffered writes to each client (browser) who listens
It was an easy choice picking Go as the language due to its performance, stability and ease-of-use. Moreover, when it comes to deploying your code to Lambda you no longer need to worry about dependencies - build your code and ship your executable to Lambda and you're good to go!
For more information on Go performance metrics feel free to check out my previous post here.
Putting it all together
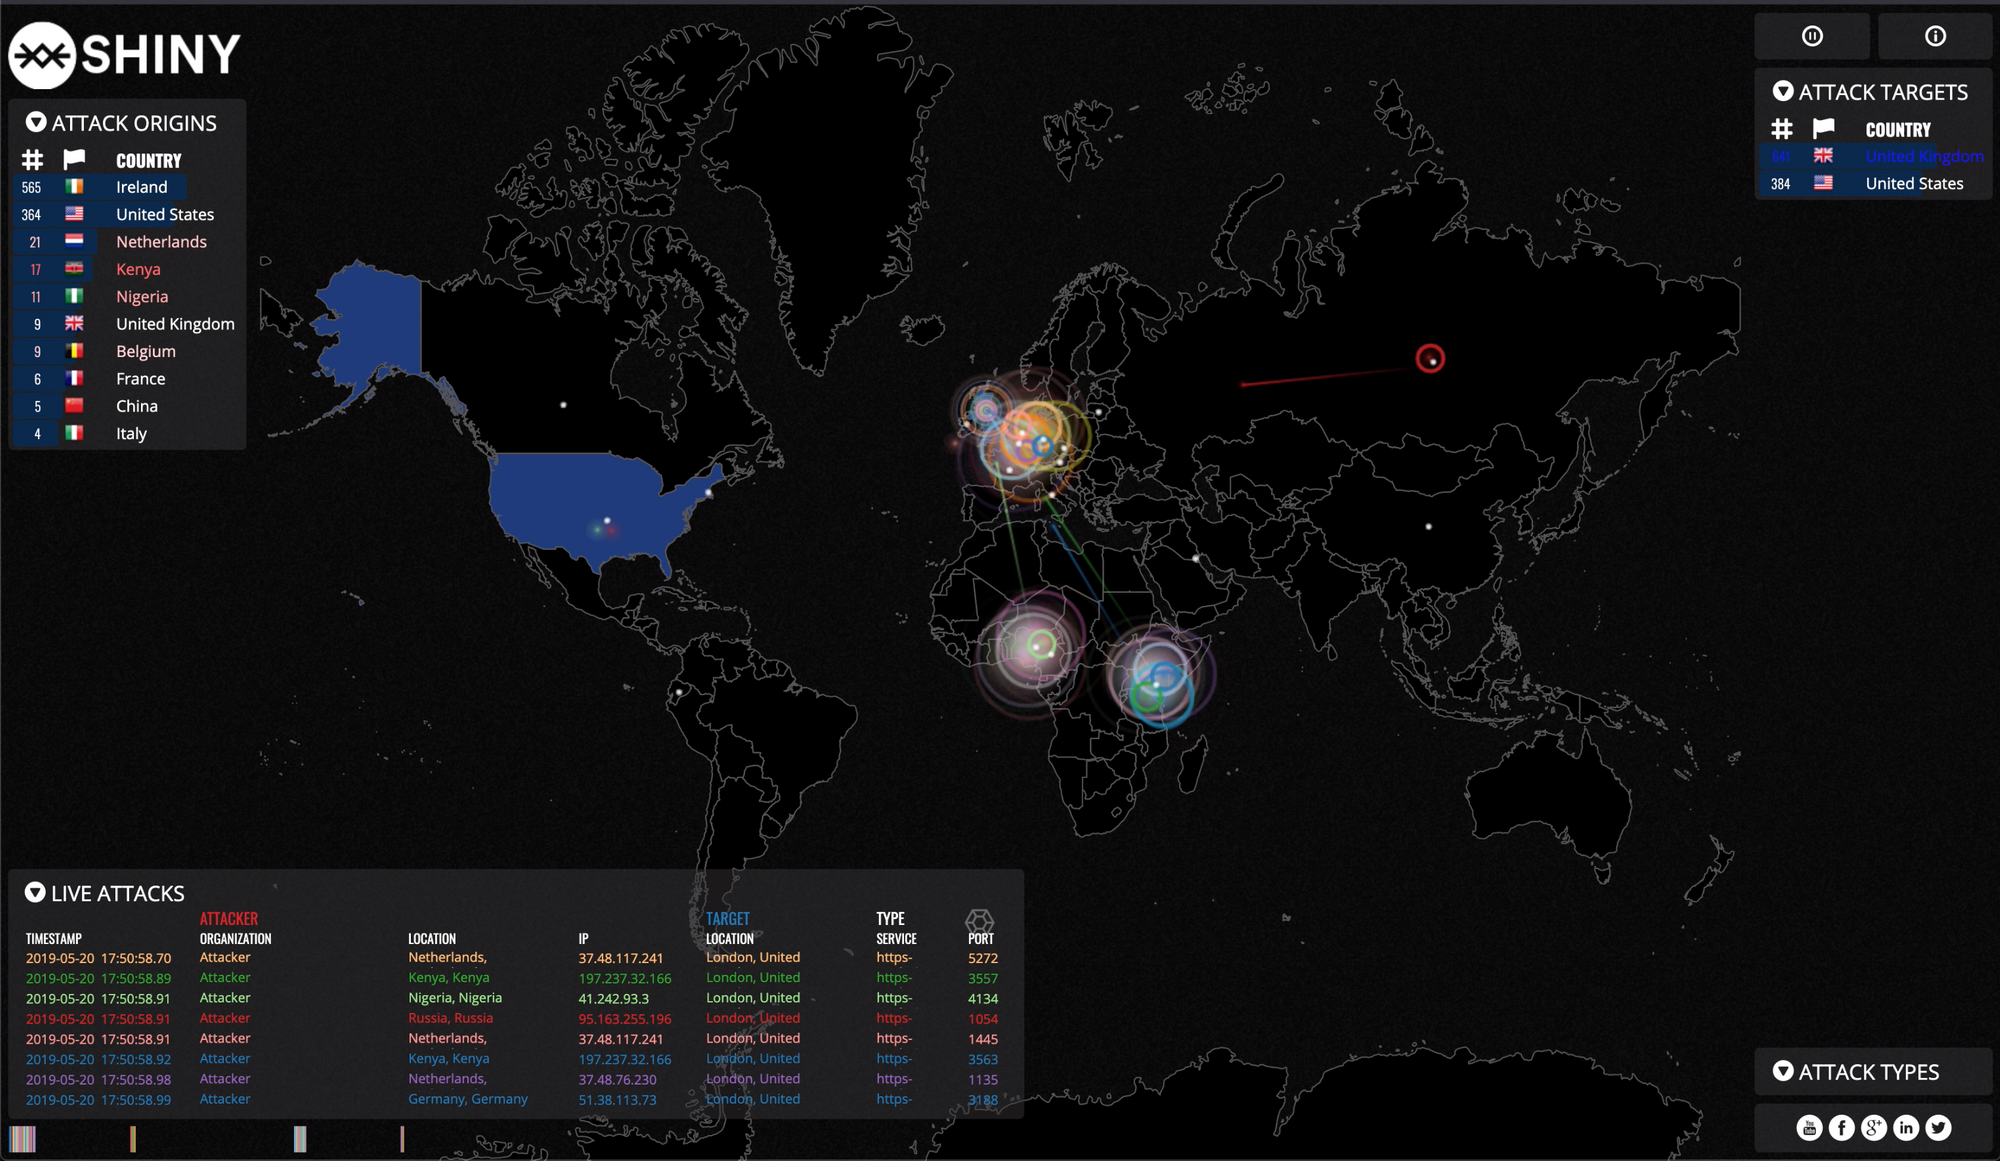
Now that we've got all our moving parts configured, it's time to start visualising! The end goal is a client-side web application that listens to broadcast requests originating from our Go websocket server.
Find a map that suits your needs, in my case I found the norsemap-like clones to be suitable for the kind of traffic I wanted to visualise. Depending on your needs, you might want to consider some of the other excellent examples on Github. Grab yourself a copy and see how far you get!
Things to consider when building this out
IP Geolocation mapping
Mapping a country code to an IP address is pretty straight forward. In fact, you could hold a spreadsheet with less than 200 lines of code for your lookups. Or you might want to consider going down to the "city" or "state" level, and therefore purchase an up to date database suitable to your needs.
Dealing with streams
Capturing Lambda events is as simple as defining your Handler function. My Golang function definition looks like:
func Handler(ctx context.Context, s3Event events.S3Event) {
	...
}
However, the fact that we're dealing with events means you have no guarantee that the response.EventStream object is going to give you valid JSON for each event. Therefore, you might need to:
- Keep track of your opening and closing JSON strings (
{,}) - Use an event streaming service such as AWS Kinesis
In both cases you should guarantee you're properly handling the stream as expected by your websocket listener.
What else could you do with this set up?
Given an arbitrary data source and your event-based system configured to ingest data in a structured way, it wouldn't be too difficult to transform captured events into something more meaningful. One example that comes to mind for an online store is successful purchases.
So long as you know the endpoint on which successful transactions take place, you could customise the map to show, in semi real-time, purchases across the globe for the events you are interested in! Overlay that with your advertising spend in a particular region of the world and you've got yourself a pretty powerful marketing tool.
Final thoughts
Visualising your attack traffic is made easy with cloud services, and you too can build your own. Sometimes we forget just how much noise is really on the Internet at any given time, and having a visualisation that is both meaningful and engaging can be a fantastic conversation starter. Let me know your thoughts!